
The Green Square area of Sydney was about to boom. City of Sydney council was doing an amazing job of building infrastructure. As a result, they had started building the Aquatic Centre and award-winning Green Square Library. With so many approved DAs, the council wanted a development chart design to show the growth.
Development Chart Design
The benefit of the chart was to show a snapshot of the rapid growth Green Square was about to experience. All stakeholders had to be on top of the progress in order to keep up. This included the state government who had to build schools and roads. Much of the City of Sydney building work depended on other government organisations doing their part.
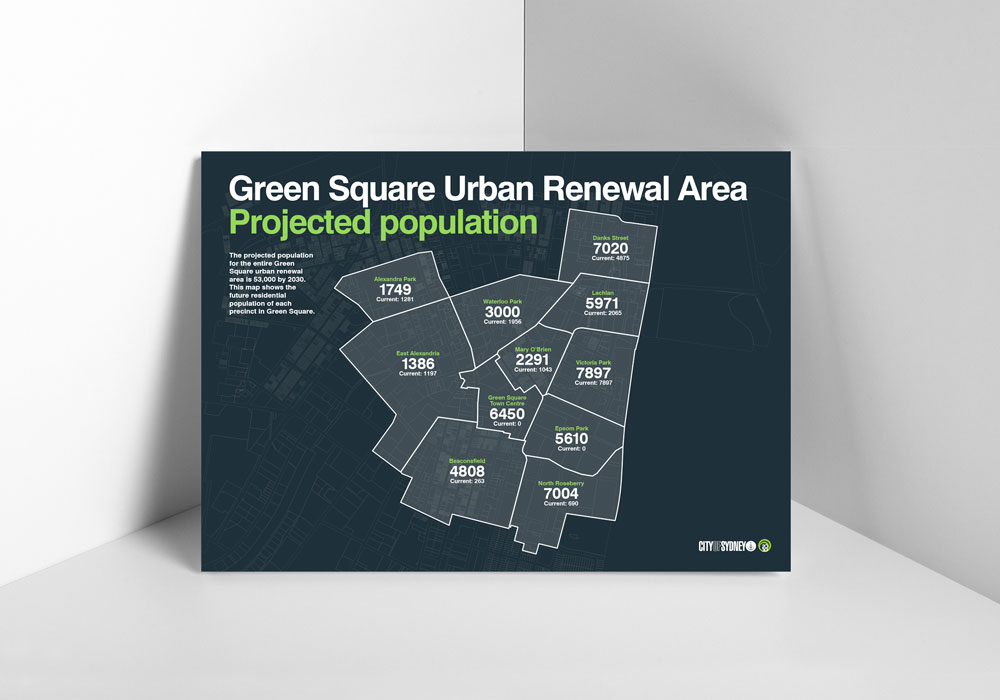
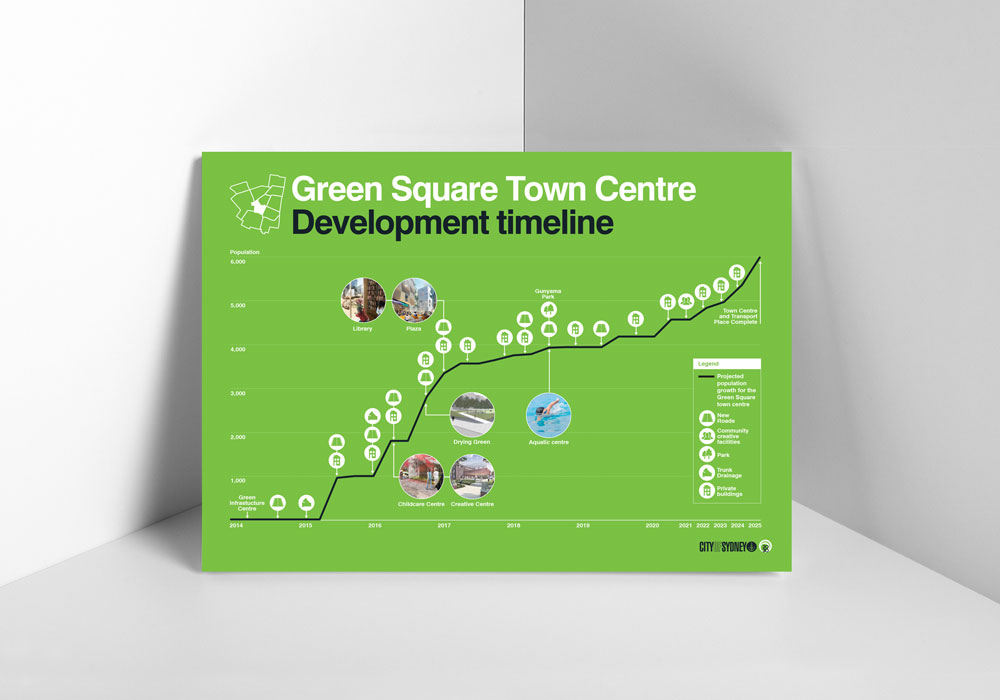
The front side of the document showed the Green Square areas. It also displayed the projected population in 2030. Importantly, the back of the document showed the timeline. The council buildings milestones are scattered along the timeline. The icons show approved DAs as well as buildings under construction. The population growth is shown along the left-hand side with horizontal lines.
Local Council Graphic Design
Kollectiv enjoys local council and community strategy and design work. To see more council work, click here.